|
|
MD & A |
|
MD &
A |
|
MD & A Three |
Management's Analysis of Consolidated Operations (continued) Credit
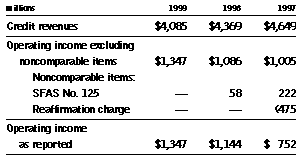
Operating income as reported was $1.35 billion in 1999, an increase of $203 million over the 1998 level. Although credit revenue decreased during 1999, operating income favorability resulted from a lower provision for uncollectible accounts as the quality of the portfolio improved due to improved risk management techniques and investments made in the collection process. Increases in SG&A were more than offset by lower interest expense. In 1998, the primary reason for the $392 million increase in reported operating income in the Credit segment compared to 1997 was the $475 million reaffirmation charge which adversely affected 1997 results. In 1999, Credit revenues decreased 6.5% to $4.09 billion. The decrease in Credit revenues was attributable to a lower level of average owned credit card receivables and lower retained interest assets. In 1998, Credit revenues decreased 6.0% to $4.37 billion, reflecting lower average owned receivable balances, and the 53rd week of revenues contained in 1997. A summary of certain Credit information for the managed portfolio is as follows:
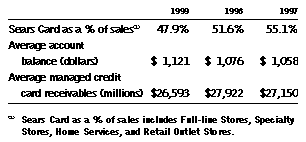
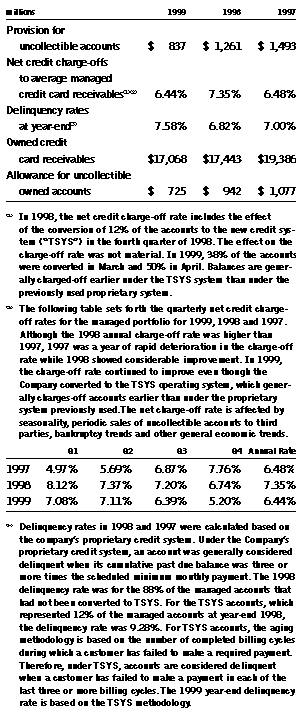
The percentage of merchandise sales and services transacted with the Sears Card in 1999 declined to 47.9% compared to 51.6% in 1998, due to a greater preference for other payment methods, including cash, check and third-party credit cards. Credit selling and administrative expense increased 9.0% in 1999 from the 1998 amount. This increase was primarily attributable to increased investment in credit collection efforts, enhanced risk management systems, the TSYS conversion costs and the launch of the Sears Premier Card. In 1998, selling and administrative expense increased 7.7% from the 1997 level primarily due to increased collection and risk management activities and litigation costs. Domestic provision for uncollectible accounts and related information is as follows:
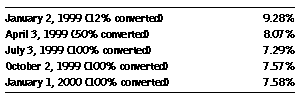
The delinquency rates for accounts that had been converted to TSYS were as follows on a quarterly basis through 1999:
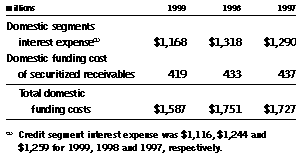
In 1999, the domestic provision for uncollectible accounts decreased $424 million to $837 million. The decrease is attributable to lower average owned credit card receivable balances and improvement in portfolio quality during the year. As shown in the table above, delinquency rates on a TSYS basis declined from year-end 1998, when delinquencies were at 9.28%, to 7.58% at the end of 1999. In addition, the net charge-off rate for 1999 decreased to 6.44% from 7.35% in 1998. The allowance for doubtful accounts at year-end is $725 million, or 4.26% of on-book receivables as compared to 5.44% at the prior year-end. In 1998, the provision for uncollectible accounts decreased 15.5% from 1997. The decrease was primarily attributable to favorable trends in delinquency rates, charge-off experience and bankruptcy filings, as well as lower owned credit card receivable balances and one less week of provision expense in 1998 compared to 1997 due to the effect of the 53rd week. As of January 2, 1999, the allowance was $942 million compared to $1.08 billion at January 3, 1998. The $135 million decrease in the allowance for uncollectible accounts related to the improvement in portfolio quality and the reduction in owned credit card receivable balances. The owned credit card receivables decreased $1.94 billion during 1998 primarily due to the transfer of credit card receivables from Sears to a securitization Master Trust to provide receivable balances for future securitizations. Receivables transferred to the securitization Master Trust in 1998 were classified as retained interest in transferred credit card receivables in the balance sheet, and were transferred net of the related $106 million allowance balance. Interest expense from the domestic segments is included in the Credit segment discussion because the majority of the Company's domestic interest expense is allocated to the Credit segment. Generally, the domestic interest expense that is not allocated to the Credit segment is allocated to the Retail segment and is not a significant cost relative to costs of sales, buying and occupancy, selling and administrative expense, and depreciation and amortization expense in the Retail segment. Domestic interest expense is combined with the funding cost on receivables sold through securitizations to represent total funding costs. The Company uses credit card receivable securitizations as a significant funding source and therefore, for purposes of this analysis, the interest paid on securitizations is considered a funding cost. The total domestic funding costs are as follows:
Total domestic funding costs decreased 9.4% in 1999 to $1.59 billion. The decrease in funding costs reflects the lower level of average managed credit card receivable balances and a lower funding rate environment. In 1998, the increase in funding costs reflects higher funding requirements due to a higher average managed credit card receivable portfolio, higher inventory levels and capital spending and share repurchases partially offset by a lower funding rate. Corporate
International
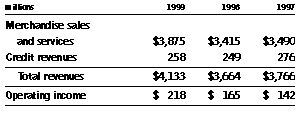
International operations include the results of Sears Canada for all periods presented and the results of Sears Mexico through the first quarter of 1997, when the Company sold its majority interest. International revenues were $4.13 billion in 1999, a 12.8% increase from revenues of $3.66 billion in 1998. International revenues increased as Sears Canada experienced favorable results across all formats including Full-line stores, dealer stores, furniture stores, catalog, and credit. Comparable store sales were strong throughout the year. In 1998, revenues decreased 2.7% from 1997 due to the inclusion of $100 million of revenues related to Sears Mexico in the prior year. Sears Canada had strong retail and catalog sales performance in 1998 compared to 1997. However, the favorable perfor- mance was partially offset by the negative effects of a weaker Canadian dollar. International gross margin as a percentage of International merchandise sales and services increased 130 basis points in 1999 from 1998 primarily due to a sharper focus on the management of the cost of goods sold. In 1998, gross margin as a percentage of merchandise sales and services decreased 30 basis points from 1997 primarily due to increased buying costs. International selling and administrative expense as a percentage of total revenues was relatively flat in 1999 compared to 1998 as payroll, benefits and other related costs kept pace with the higher sales levels. In 1998, International selling and administrative expense as a percentage of total International revenues improved 90 basis points from 1997. The selling and administrative rate improvement was primarily due to leveraging payroll and other employee related costs. International operating income improved $53 million in 1999 compared to 1998. Operating income improved $23 million in 1998 compared to 1997. The improvement in both years is due to revenue growth resulting from the aggressive growth strategy in the furniture and dealer store networks and renovations of Full-line stores. On December 30, 1999 Sears Canada acquired T. Eaton Company for $66 million. The acquisition included trademarks, leases on 16 stores and certain tax net operating loss carryforwards. Other Income
Income Tax
Expense Market Risk
Inflation
Outlook Cautionary
Statement Regarding Forward-Looking Information |
|
Annual Report 1999 |
|